Ethereum Slides Below $1,750 as ETF Outflows Deepen, Fear Spikes
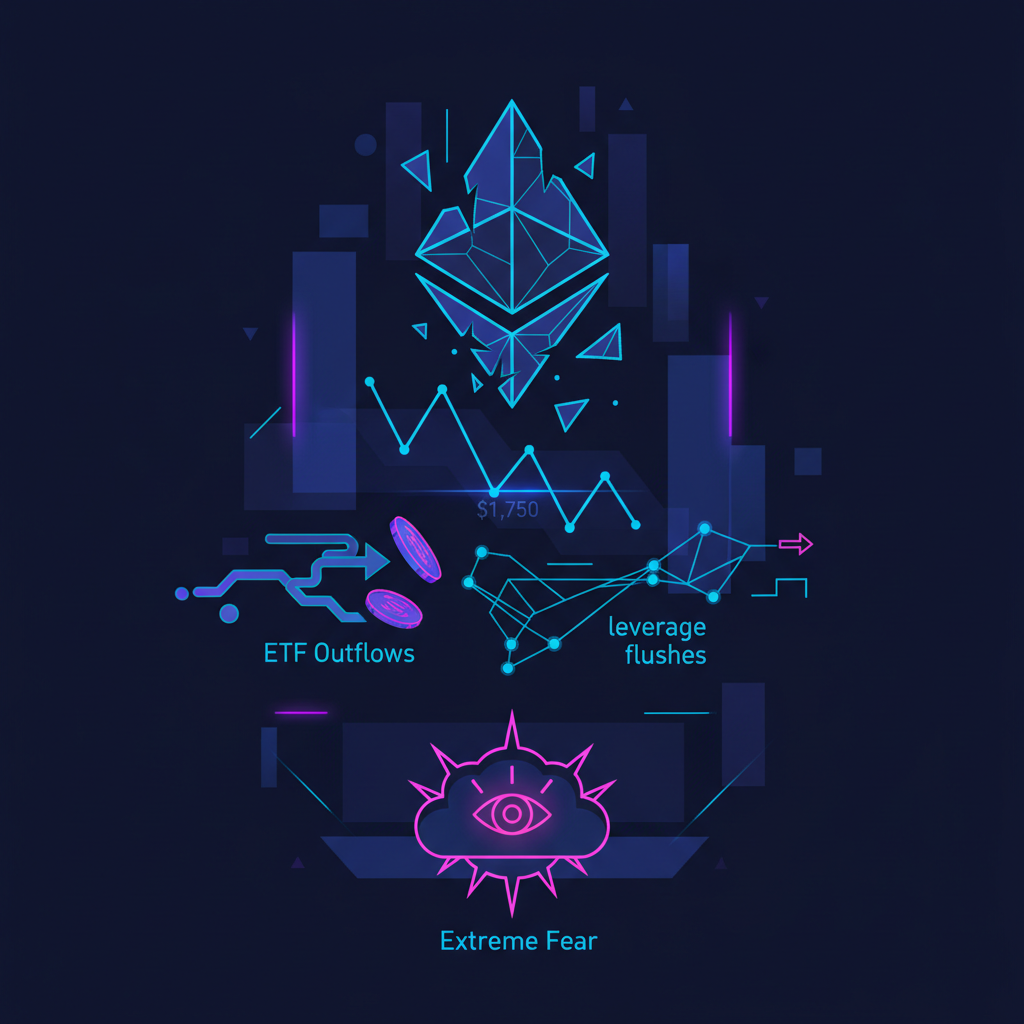
Ethereum has slipped into the mid-$1,700s, extending a multi-week downtrend as selling pressure from U.S. spot ETH ETF outflows, a broad crypto risk-off move, and a sharp reset in derivatives leverage converge. With ETH trading around $1,734, down about 3% over 24 hours and sporting a market cap near $209 billion, the market is asking the same question it usually asks at this stage of a drawdown: is this a true capitulation low, or is more pain still ahead?
Sentiment is firmly risk-off. The Crypto Fear and Greed Index sits at 15, squarely in Extreme Fear, a zone that has often coincided with prior local bottoms but can also persist longer than most traders expect. At the same time, U.S. spot Ethereum ETFs are posting continued net outflows, derivatives funding has flipped negative, and open interest has been cut back, pointing to a classic washout of leveraged longs rather than a calm consolidation.
Price action: ETH breaks toward the mid-$1,700s
Ethereum is now trading around the $1,730-$1,740 area with a roughly 3% 24‑hour decline, underperforming Bitcoin and deepening its pullback from the post-ETF approval highs. Recent market commentary from outlets tracking the selloff notes that ETH has been grinding lower as ETF flows turned negative and macro sentiment soured, with several reports highlighting a multi-session series of ETF outflows aligned with this move.
Market structure has deteriorated in stages:
- ETH first lost key resistance and consolidation zones at materially higher levels, which had formed after the initial spot ETH ETF approval rally.
- As prices rolled over, the market repeatedly tested support shelves before finally sliding toward the $1,800-$1,750 band, a region flagged by multiple analysts as critical short term structure.
- The latest leg has now taken ETH below $1,750 on intraday wicks, bringing the February-March low cluster and deeper targets back into focus for traders.
Several recent analytic notes, including those from crypto-focused research desks and broker platforms, have described this as a "local acceleration" of an already established downtrend driven less by a single shock and more by persistent structural selling and positioning imbalances.
ETF flows: institutions are selling strength, not buying the dip
The most important driver on the flow side is the continued net outflows from U.S. spot Ethereum ETFs. Recent reports from large data aggregators and crypto media point to:
- Multi-session streaks of net outflows from U.S.-listed spot ETH funds, in contrast to the initial inflow burst that followed ETF approvals.
- Daily outflows in the tens of millions of dollars, with some coverage highlighting a double digit run of consecutive outflow days and cumulative redemptions in the hundreds of millions of dollars.
- A clear narrative that traditional and quasi-institutional holders are leaning out of ETH exposure on rallies rather than stepping in as aggressive dip buyers.
In practical terms, that means two things for the current selloff:
- Spot ETFs, which many hoped would act as a structural bid, have instead become a source of supply as investors cash out exposure acquired around or after the approval run-up.
- The fading of ETF demand removes an important counterweight to native exchange buyers, so when derivatives unwind and retail selling picks up, there is less passive capital to absorb it.
Several analyses this week have characterized the current flow regime as one where institutional and ETF money is fading the rally rather than seeing sub‑$2,000 or sub‑$1,800 levels as a bargain. That is a meaningful sentiment shift compared with the optimism that accompanied spot ETF approvals.
Derivatives: leverage flush, negative funding, and open interest reset
Derivatives data is sending a classic capitulation-style signal. Across major perpetual futures venues, analysts have noted:
- Funding rates flipping negative on ETH perpetual swaps, indicating that short positions are dominant and longs must pay less (or even receive funding) to hold exposure.
- A sharp drop in open interest as traders cut risk, close underwater long positions, and liquidations clear out crowded trades.
- An overall shift from a leveraged long bias to a more neutral or even short-leaning positioning profile.
Recent commentaries on Ethereum's price dynamics tie the latest leg lower to a broad crypto "deleveraging" episode, with reports citing hundreds of millions of dollars in long liquidations across majors during the worst intraday flushes. For Ethereum specifically, the combination of ETF outflows and derivatives liquidations has created a feedback loop:
- ETF redemptions add steady spot selling pressure.
- Spot weakness forces leveraged longs to cut or get liquidated, magnifying intraday downside.
- Lower prices in turn validate ETF sellers' caution, reinforcing the outflow trend.
This is why several desks are characterizing the current environment as a flush, not a gentle consolidation. The price action is fast, order books thin out during the heaviest selling, and realized volatility spikes as positions get unwound.
Key technical levels: $1,700 support in focus
With ETH now trading around $1,734, the immediate technical focus is on the $1,700 zone, which many chartists are treating as the key pivot between a tradable bottom and a deeper slide toward earlier lows.
Recent technical commentary across trading platforms and media has highlighted several levels:
| Level | Role | Why it matters now |
|---|---|---|
| $1,800-$1,750 | Broken support / near-term resistance | Area of recent consolidation and heavy trading, now likely to cap bounces until reclaimed. |
| $1,700 | Immediate support | Clean break below on a daily close would confirm another leg lower and discourage short-term dip buyers. |
| February-March lows | Next downside zone | Cluster of prior swing lows; a magnet if $1,700 fails with volume. |
| $1,900-$2,000 | Upside target on strong bounce | Psychological and technical zone that would need to be retaken to change the medium-term narrative. |
The market playbook around $1,700 looks roughly like this:
- If $1,700 holds, especially with intraday wicks below that quickly get bought, it can form the base of a tradable swing low, particularly given the extreme fear backdrop.
- If ETH breaks and closes below $1,700 on convincing volume, many traders will look toward the February-March lows as the next logical downside area, with some bearish pattern targets sitting even lower.
Several macro-focused analyses also note that Ethereum's price is still reacting to broader headwinds from a relatively hawkish Federal Reserve stance, persistent inflation concerns, and pockets of risk-off behavior in equities and bonds. Those macro pressures make it harder for a purely technical bounce to extend without at least some improvement in the broader asset allocation environment.
Sentiment: Extreme Fear, but is it capitulation yet?
The Crypto Fear and Greed Index at 15 places the market deep in Extreme Fear. Historically, such readings have often appeared near local bottoms in crypto, as was the case during several prior risk-off episodes where BTC and ETH carved out lows amid heavy pessimism.
However, there are two sides to the contrarian argument:
- Bullish contrarian case: Extreme Fear, negative funding, and cleaner derivatives positioning suggest much of the fast money has already been flushed out. For traders with a medium-term horizon, these conditions often provide favorable entry points, especially if key supports hold and ETF outflows stabilize.
- Bearish caution case: Extreme Fear can persist. ETF outflows and macro headwinds indicate that structural sellers are still active. What looks like a capitulation low can morph into a slow grind lower if new buyers stay on the sidelines and on-chain activity fails to re-accelerate.
Recent coverage of Ethereum's ETF flows in particular frames this as a sentiment reset within the institutional community. Instead of the ETFs acting as a one-way accumulation vehicle, we are seeing active risk management, with capital coming out as performance and macro signals turn against high beta assets.
Fundamentals: ethereum development vs price fatigue
One of the more striking aspects of the current selloff is that it arrives against a backdrop of continued ethereum development progress. Core teams and the broader ecosystem are still shipping upgrades, scaling initiatives, and tooling improvements, even as the token price slides.
Recent headlines and developer updates have pointed to:
- Ongoing work on protocol upgrades that refine Ethereum's execution and consensus layers, targeting better performance and sustainability.
- Growth in layer 2 ecosystems and rollup infrastructure, where many builders use Solidity to deploy smart contracts across an expanding multi-rollup landscape.
- Steady, if slower, activity in DeFi, NFTs, and real-world asset experiments on Ethereum, indicating that builders are still in execution mode despite price weakness.
This divergence between on-chain and developer fundamentals and market pricing is familiar to long-time Ethereum participants. Historically, long stretches of quiet but intense building in the ethereum development ecosystem have often coincided with periods of price fatigue or downtrends, which only become obvious in hindsight once the next adoption wave arrives.
In the near term, however, fundamentals are not fully insulating ETH from macro and positioning pressures. Until ETF flows stabilize and risk sentiment improves, even strong Solidity-based application growth may struggle to translate into sustained upside for the token price.
Capitulation low or another step down?
Whether current conditions mark a durable low or simply another step in a larger downtrend depends on how several variables evolve over the coming sessions and weeks:
- ETF flows: A clear shift from consecutive net outflows toward flat or positive flows would signal that institutional selling pressure is easing.
- Derivatives positioning: Signs that negative funding is normalizing and open interest is rebuilding in a more balanced fashion would point to a healthier market structure.
- Price reaction at $1,700: Strong defense of this level with rising spot volumes could validate the capitulation-low narrative. A clean break, especially if accompanied by renewed ETF outflows, would favor the lower-low scenario.
- Macro tone: Any perceived softening in the Fed's stance or improvement in risk sentiment across equities and credit would make it easier for ETH to mount a sustained recovery.
For now, traders are operating in an environment where the dominant forces are risk reduction, outflows, and fear. That combination often leads to attractive medium-term opportunities but can be very difficult to time precisely on a short horizon.
FAQ
Is this a good time to buy Ethereum?
ETH is trading near recent lows with Extreme Fear and a significant reset in leverage, conditions that historically have produced attractive entry points for some investors. However, ongoing ETF outflows and macro uncertainty mean that price could still move lower, so position sizing and time horizon are crucial. This is not investment advice.
Why are Ethereum ETFs seeing outflows?
Recent data shows sustained net outflows as investors lock in gains from the post-approval rally, manage risk amid macro headwinds, and redeploy capital into other assets. The result is that ETFs, instead of adding structural demand, have become a source of spot selling pressure in the short term.
What key price levels should ETH traders watch now?
The immediate focus is on support around $1,700. Below that, traders are watching prior February-March lows as the next downside zone. On the upside, reclaiming and holding above the $1,800-$1,900 region would be an early sign that the worst of the current selloff might be over.
How do derivatives metrics affect Ethereum’s price?
Negative funding rates and falling open interest suggest that leveraged longs are being flushed out and that traders are less aggressively positioned. This can reduce the risk of further forced selling but also means that upside moves might initially lack fuel until new positions are built.
Does ongoing ethereum development matter in the short term?
Active ethereum development and continued Solidity-based building on the network are important for long-term value, but they do not always translate into immediate price support. Short-term moves are still dominated by flows, macro sentiment, and positioning.
What to watch next
Over the coming days, ETH traders and investors will be watching:
- The next batch of U.S. spot ETH ETF flow data to see if outflows slow or reverse.
- Changes in funding rates and open interest across major derivatives venues.
- Price behavior around the $1,700 level and any tests of the February-March lows.
- Macro catalysts, including Fed communication, inflation data, and moves in major equity indices and bond yields.
- On-chain metrics such as active addresses, DEX volumes, and staking flows, which can hint at whether organic demand is quietly rebuilding.
If ETF outflows moderate and ETH can hold or reclaim the $1,700-$1,800 area, the current washout could evolve into a constructive base. If not, traders should be prepared for the possibility that what feels like capitulation today may only be a waypoint on a longer journey to a more convincing bottom.
Disclaimer: This article is for informational purposes only and does not constitute financial, investment, or trading advice. Always conduct your own research and consider your risk tolerance before buying or selling any cryptocurrency.
This article is for informational purposes only and is not financial advice.