Ethereum Nears $2,500 as Greed Index Holds at 71
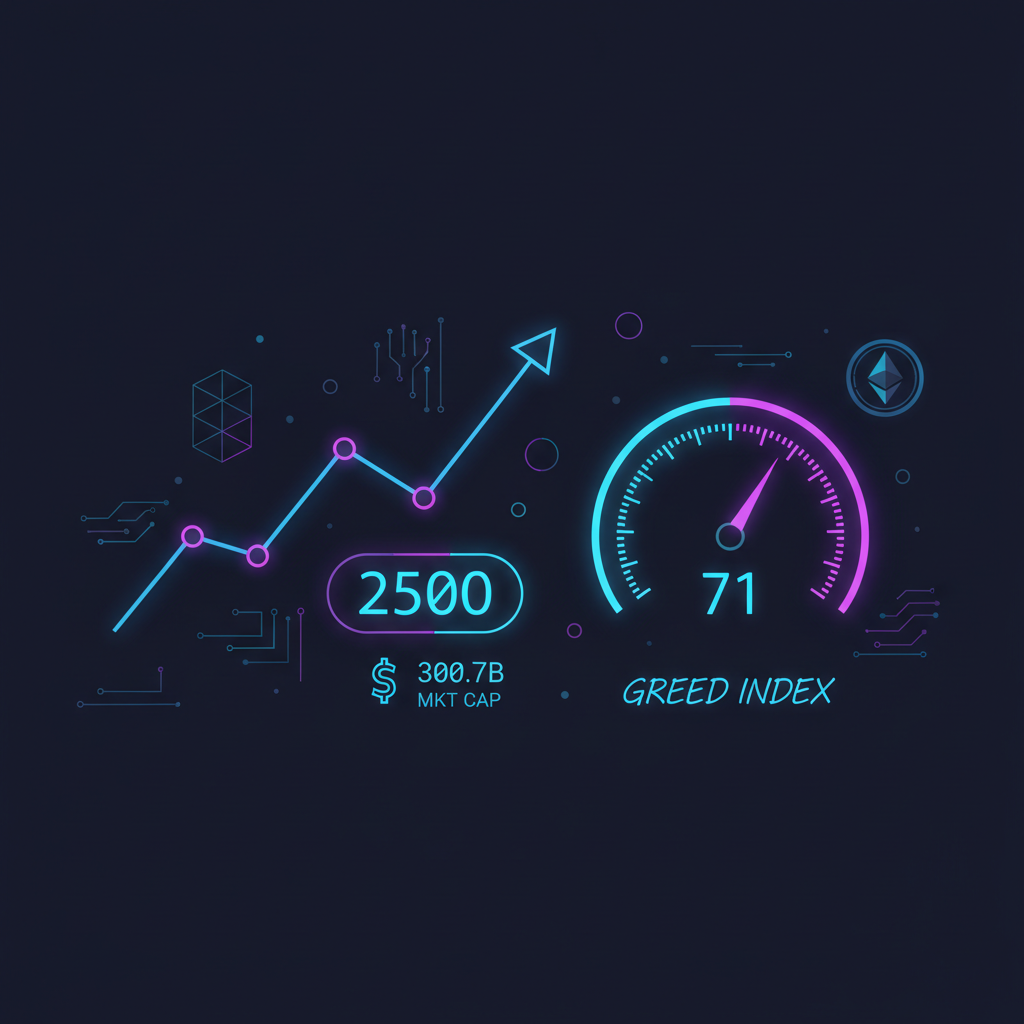
Ethereum is trading at $2,492 on Thursday, August 27, 2026, up 1.32% over the past 24 hours. The second-largest cryptocurrency by market capitalization is consolidating just below the psychologically significant $2,500 level after breaking above $2,400 earlier this week. With the Crypto Fear and Greed Index holding firm at 71 in Greed territory and Ethereum's market cap reclaiming the $300 billion threshold, bulls appear to be maintaining control as traders watch for a decisive move higher. The current setup reflects a market that has absorbed selling pressure without giving back recent gains, a dynamic that often precedes continuation patterns rather than sharp reversals. Market participants are now weighing whether this consolidation will resolve to the upside or if the $2,500 barrier will force a deeper retracement before the next leg higher.
Price Action Nears Major Resistance
ETH has climbed steadily toward the $2,500 zone, a level that has historically acted as a pivot for short-term sentiment. The advance from above $2,400 to the current $2,492 represents a measured, stair-step progression rather than a vertical spike, suggesting spot-driven accumulation rather than leveraged speculation. Each minor dip during this climb has been bought relatively quickly, indicating that demand is present on weakness. A sustained break above $2,500 could open the door to further upside and attract momentum-based strategies, while failure to clear this zone on strong volume may trigger a retest of underlying support near the prior breakout area.
Market Cap Reclaims $300 Billion
Ethereum's market capitalization stands at approximately $300,722,114,587, reflecting renewed confidence across the ecosystem. Reclaiming the $300 billion mark is more than a symbolic milestone: it signals that capital is flowing back into ETH at a pace that outmatches broader market friction. This expansion in valuation aligns with the broader risk-on posture seen across digital assets this week. When market cap grows alongside price without an excessive spike in leverage, it typically indicates genuine capital inflows rather than derivative-driven noise. For institutional allocators, the $300 billion level often serves as a reference point for liquidity and network scale.
Fear and Greed Index Stuck in Greed Territory
The Crypto Fear and Greed Index registered 71 in the latest session, squarely within the Greed zone. Readings above 70 typically reflect strong bullish conviction, though they can also precede periods of consolidation as overheated positioning unwinds. For now, the index suggests that market participants remain net optimistic, with buying interest outweighing defensive hedging. Sentiment indicators are not timing tools, but they do measure the temperature of the crowd. A sustained reading near 71 over multiple days can indicate durable confidence, yet traders should remain alert for any sudden divergence where price makes higher highs while sentiment cools.
Stablecoin Liquidity Underpins the Rally
On-chain activity indicates that stablecoins continue to play a critical role in Ethereum's price structure. Assets such as USDC provide a primary quote currency for decentralized trading pairs and DeFi collateral, meaning expansions in stablecoin supply on Ethereum often precede spot buying pressure. When traders convert idle stablecoin balances into ETH, the resulting demand can accelerate moves through key resistance levels. Because USDC is natively issued on Ethereum, its circulating supply on the network acts as a real-time gauge of dry powder available for deployment into ETH and other tokens. Current network data shows healthy stablecoin depth across major Ethereum-based protocols, offering a liquidity backstop that may cushion any pullbacks. The presence of deep USDC liquidity on Ethereum also reduces slippage for large orders, making the network more attractive to institutional-sized flows that require efficient execution without moving the market excessively.
Technical Levels to Watch
Traders are monitoring the following zones as ETH approaches $2,500. These levels are derived from recent price action and standard technical reference points:
| Level | Significance |
|---|---|
| $2,550 to $2,600 | Upper resistance zone; breakout target if $2,500 clears on volume |
| $2,500 | Psychological resistance and immediate barrier for bulls |
| $2,492 | Current price; intraday pivot for short-term sentiment |
| $2,400 | Prior breakout level; now initial support to hold |
| $2,320 | Secondary support and recent range low before the breakout |
The structure above $2,400 remains constructive as long as buyers defend the former resistance turned support. A drop below $2,320 would suggest that the breakout has failed and that range-bound conditions may return.
What to Watch Next
- $2,500 test: Whether ETH can close above this level on daily timeframes will likely set the tone for the weekend. A confirmed breakout could target $2,600, while rejection risks a slide to $2,400.
- Stablecoin inflows: Monitoring USDC and other stablecoin inflows to Ethereum exchanges and smart contracts may provide early clues about continued buying power. Rising stablecoin supply on-chain often foreshadows spot demand.
- Bitcoin correlation: ETH's ability to outperform or decouple from BTC will indicate whether this is an ecosystem-specific move or part of a broader risk-on drift across crypto.
- Funding rates: Elevated perpetual funding could signal crowded longs, raising the risk of a quick liquidation flush that drags price back below $2,400.
- Macro catalysts: Any shifts in traditional risk assets or rate expectations can spill over into crypto, so equities and dollar strength remain relevant background factors.
Frequently Asked Questions
Why is $2,500 important for Ethereum?
$2,500 represents a psychological resistance level. Prices often stall or reverse at round numbers because they influence trader behavior and algorithmic order clustering. Beyond the mental anchoring, $2,500 also marks a zone where prior supply has emerged, making it a technical and psychological double barrier.
What does a Fear and Greed Index of 71 mean?
A reading of 71 falls in the Greed category. It indicates that sentiment is bullish, but it also warns that the market may be becoming overheated and due for a cooldown. The index aggregates volatility, momentum, social media, and dominance data into a single score.
How do stablecoins like USDC affect ETH price?
USDC and other stablecoins serve as primary trading pair collateral on Ethereum. Large stablecoin balances on the network can quickly rotate into ETH, creating buying pressure that supports price advances. Deep USDC pools also enable efficient large trades without excessive slippage.
Is the current rally driven by spot or leverage?
The gradual climb from $2,400 to $2,492 suggests spot-driven demand. Sharp leveraged rallies usually feature larger hourly candles and rising open interest, which have not been the dominant feature of this move. Spot buying tends to produce more durable trends than leverage-driven spikes.
What happens if ETH rejects at $2,500?
A rejection could send ETH back toward the $2,400 breakout level. If that support fails, the next downside zone to watch sits near $2,320. Traders often place stops just below breakout levels, so a failure to hold $2,400 could accelerate selling as those stops trigger.
Disclaimer: This article is for informational purposes only and does not constitute financial advice. Cryptocurrency prices are volatile, and past performance does not guarantee future results. Always conduct your own research before making investment decisions.
This article is for informational purposes only and is not financial advice. Links marked “Sponsored” are affiliate/referral links.